Climate-related Metrics
Climate change is not only an environmental challenge but a significant financial risk on a global scale. As temperatures continue to increase, climate policies evolve, and new technologies emerge, it becomes crucial for financial markets to have transparent, comprehensive, and high-quality information. This information helps navigate the complexities of climate-related impacts, both in terms of risks and opportunities.
We provide, and use, a range of backward and forward-looking metrics as it is important to analyse climate performance through a range of metrics, as each metric highlights a different perspective on climate performance. It is important to be aware of the shortcomings of climate metrics, in that they can be impacted by currency fluctuations and portfolio changes.
More information about specific metrics, and the assessments of our portfolios can be found in the Brunel Climate-related Product Report.

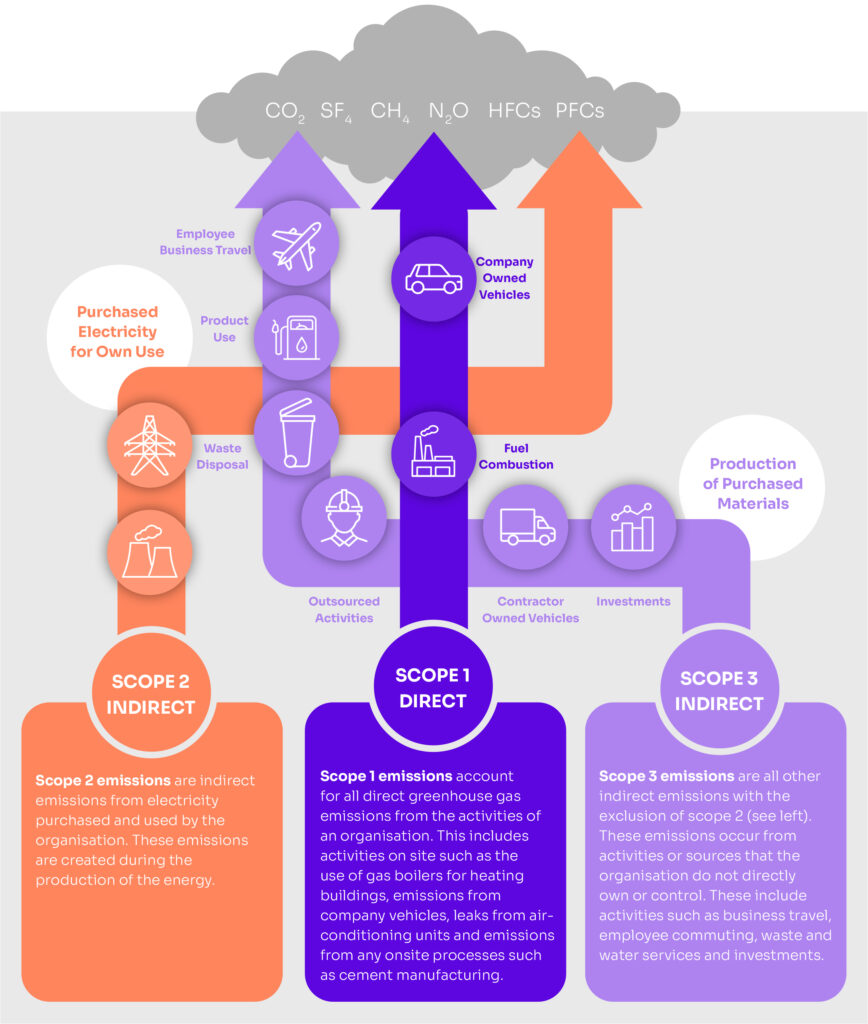
Financed emissions
Our product report covers our financed emissions which are all by definition are our principal scope 3 Greenhouse Gas (GHG) emissions – we break these down by the corporate emissions covering scope 1, scope 2 and first tier scope 3.

Backward looking metrics
| Metric | Unit | What does it tell me? | Benefits | Limitations | How we use it |
|---|---|---|---|---|---|
| Absolute Carbon Emissions | tCO2e | The absolute greenhouse case emissions associated with a portfolio, expressed in tons of CO2e | Investors ownership of emissions consistent with the GHG protocol | Size of the portfolio can skew results. Subject to market fluctuations | Portfolio and individual company level assessments (Equity and Corporate Bonds) |
| Carbon to value intensity or Emissions Intensity | tCO2e/mGBP | Emissions exposure per unit of revenue or value-of-holdings | Standard scope emissions data is used, normalised for size, allowing for comparability across portfolios | Sensitive to market fluctuations | Portfolio and individual company level assessments (Equity and Corporate Bonds) |
| Disclosure | % | Percentage disclosure by value-of-holdings or greenhouse gas emissions | Standard scope emissions data inputs | Currently only based on CO2 Scope 1 Disclosure | Portfolio and individual company level assessments (Equity and Corporate Bonds) |


Weighted Average Carbon Intensity (WACI)
WACI shows a portfolio’s exposure to carbon intensive companies; it is an indicator of the carbon risk a portfolio is exposed to. This measure is determined by taking the carbon intensity of each company and weighting it based on its holding size within the portfolio. The relevant 2019 portfolio benchmark forms the baseline, unless otherwise stated.
Forward looking metrics
| Metric | Unit | What does it tell me? | Benefits | Limitations | How we use it |
|---|---|---|---|---|---|
| Paris Alignment | °C | Climate warming scenario | Track goal of limiting global warming to below 2°C | SDA and GEVA approach used Volatility in underlying data Based on multiple assumptions | Portfolio and individual company level assessments (Equity and Corporate Bonds) |
| Carbon Earnings-at-Risk | % | Unpriced Carbon Cost as a % of EBITDA (earnings before interest, taxes, depreciation, and amortisation) | Impact to company earnings today if companies had to pay a future price | Present-day financials and emissions used Carbon prices are estimated based on hypothetical future scenarios | Portfolio and individual company level assessments (Equity and Corporate Bonds) |
| Physical Risk | % | Annual weighted average asset value | Financial costs arising from changes in all hazard exposures vs the historical baseline | Based on assumed asset value of all known assets | Portfolio and individual company level assessments (Equity and Corporate Bonds) |
| Fossil Fuel Reserves | Exposure (%) Intensity (tCO2e/mGBP) Future emissions (MtCO2e) | Proven (>90%) and probable (>50%) reserves | Assess the potential risk of stranded assets | Based on disclosure | Portfolio and individual company level assessments (Equity and Corporate Bonds) |